Free Flash animated charts, graphs, Easy and Beautiful

Online Demos
FusionCharts Blueprint Application
 This application intensively uses FusionCharts to plot charts for a fictitious trading company, which imports and exports speciality foods from all around the world. We’ve effectively combined FusionCharts, JavaScript (AJAX) and the traders database to render a seamless browsing experience.


Sales Dashboard
 FusionCharts can be effectively used to create highly intuitive and interactive financial dashboards. Using the wide variety of charts and maps available in FusionCharts Suite, you can give a lively face to all your boring data tables. In this example, we’ve used FusionCharts to create a Sales Dashboard.
Airline Dashboard
 This dashboard caters to the Airline industry. Here, we’ve combined FusionCharts and FusionMaps in an effective way to show business and statistical data for a fictional airline company – FusionAir. In FusionMaps, we’ve used the Marker Connector feature to show various flight routes for the airline company.
FusionCharts + JavaScript (AJAX) Integration
 FusionCharts v3 offers tremendous integration capabilities with JavaScript. It seamlessly binds with JavaScript/AJAX to let you update charts on the client side, without invoking any page refreshes. All the charts in FusionCharts v3 suite support this functionality.
3D Chart Demo
 FusionCharts v3 features a true 3D chart that supports dynamic rotation, scaling, camera angles, lighting angles etc. In this demo, we use the 3D chart to plot data retrieved from the trader database and allow you to play with the various interactive options that the chart offers.
US Electoral Demo
 This application lets you visually select your candidate for each US state and then create a what-if scenario for the elections.
Here, we’ve combined FusionMaps, FusionCharts and JavaScript to create an interactive demo.
Visual XML Generator
 If you’re a non-programmer, but want to build exciting charts using FusionCharts, we’ve introduced a nifty GUI just for you. This utility helps you visually build your XML data and HTML code for the charts. All you now need to do is punch your data in our interface, click a few buttons and you’re done.
PowerCharts + JavaScript Integration
 All the charts in FusionCharts can seamlessly integrate with JavaScript to create dynamic web applications. In this example, we connect the Select Scatter chart from PowerCharts suite to JavaScript functions. The JavaScript functions are responsible for reading the data chosen on the chart.
Drag-able Chart + JavaScript
 In this example, we simulate the revenue-profit scenario of an organization using a drag-able Column 2D Chart. You can visually modify the revenue and profit figures on the chart and then submit data to local JavaScript functions present on the same page.
 How to Start a Functioning Website Under Thirty Dollars 2021?
  The HTML5 Time Element Is Back and Better Than Ever
  Mozilla Introduce Firefox 9, with Speed and less memory improvements
 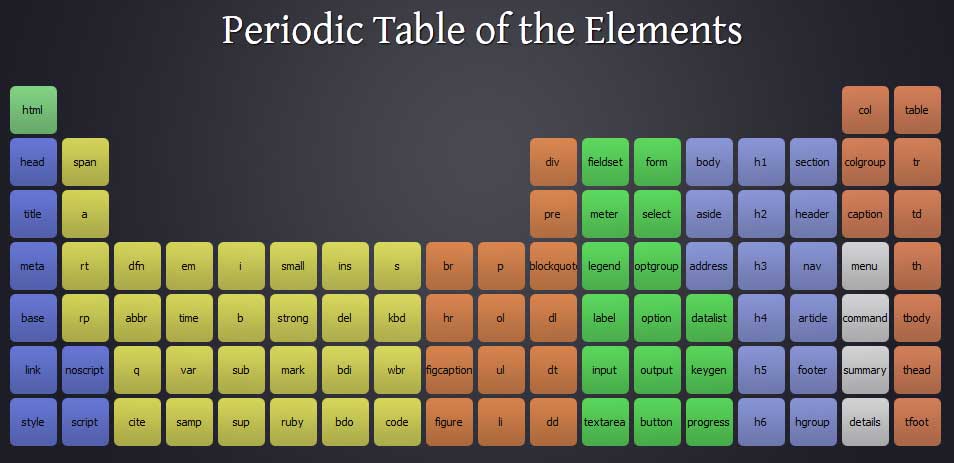 Periodeic table of HTML5 Elements, arrange by type.